> ## Documentation Index
> Fetch the complete documentation index at: https://www.presolve.com/docs/llms.txt
> Use this file to discover all available pages before exploring further.
# Create and save a report
> Start from a template, choose columns, and verify the results.
Open [Reporting](https://attorney.dearlegal.com/dashboard/reports) from **Tools → Reporting**. A report combines a data source, selected fields, and filters to answer a specific question.
## Start from a template
1. Select **New Report**.
2. Search the available templates or choose to duplicate an existing report.
3. Give the report a recognizable name and create it.
4. Inspect its data source, columns, and existing filters before changing anything. A template may already restrict the results.
## Choose what appears
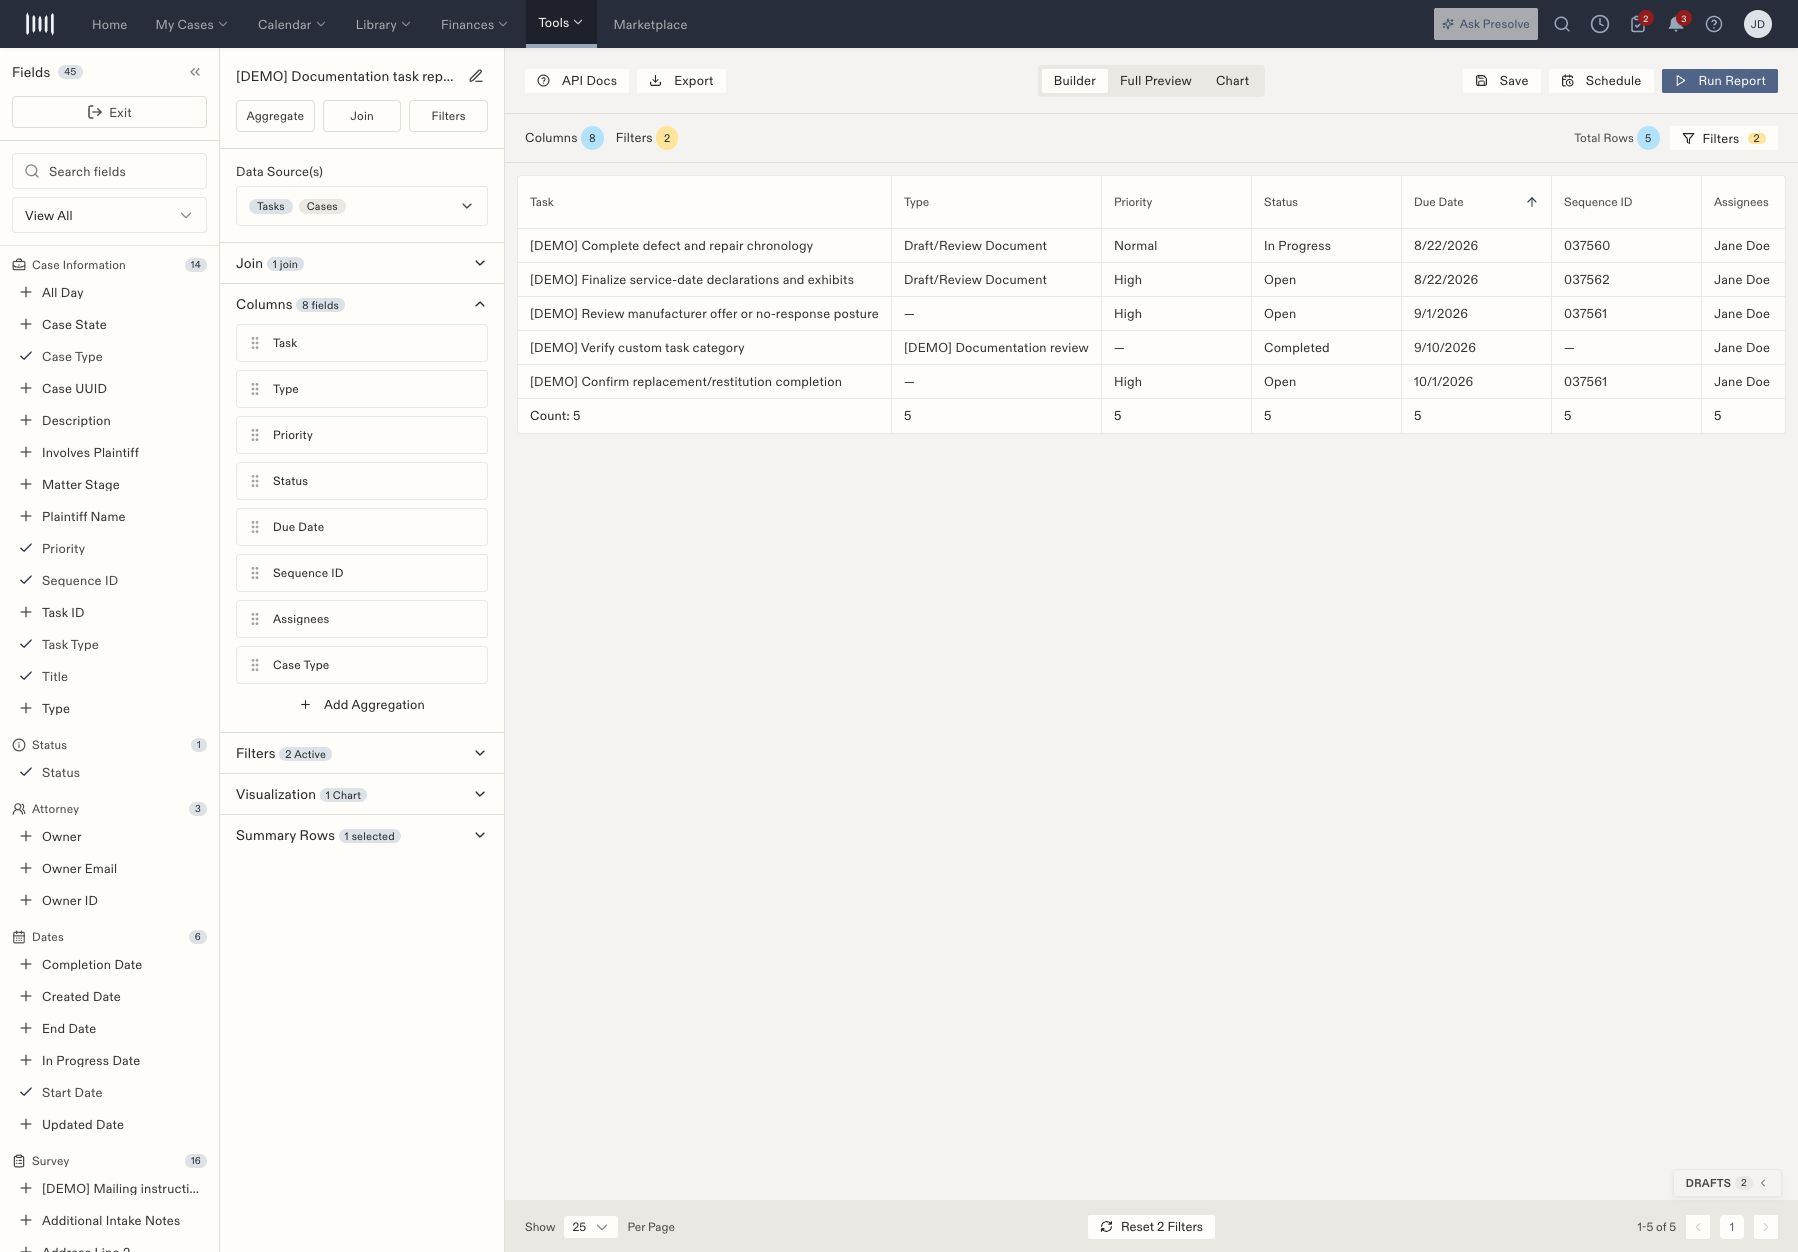
Use the Fields panel to add columns. Review **Columns** to see which fields are selected and reorder them for the reader. When you need information from a related record, inspect **Join** and then the expanded field choices.
For example, joining Cases to a task report makes case fields available. Some tasks have no case, so check what your chosen join does to those rows.
Fields added through Matter Layout appear under **Custom matter fields**. You can include them in columns and filters, group by supported fields, and summarize numbers or currency. Multi-select fields support **Has Any Of**, **Has None Of**, and empty/nonempty filters.
The same inherited field appears once across its applicable case types. Fields removed from a layout remain available with an **Archived** label, so saved reports can continue to show historical values. Custom matter fields are scoped to their owning organization.
For a Yes / No field such as **Surgery Completed?**, you can build two saved reports:
* **Completed surgery counter:** use Cases, filter **Surgery Completed? Equals Yes**, and add a **Count** aggregation of that field as the only output column. Save the report, then add it to a dashboard as a **Stat Card** with **First Cell Value**.
* **Yes / No bar chart:** use Cases, add **Surgery Completed?**, and configure a bar chart with that field as the label and **Records** as the metric. Leave off the Yes-only filter so both answers appear. Save the chart and add it to the dashboard.
An unanswered field is empty, not No. Add an **Is Not Empty** filter if you want the comparison to include only answered cases.
 ## Run, save, and reopen
1. Select **Run Report** to refresh the result table.
2. Inspect representative rows and the total row count. Check that the fields answer the question you started with.
3. Select **Save** and wait for confirmation.
4. Reopen the report and verify the selected columns and filters.
**Full Preview** displays the report results; **Chart** displays configured charts. Saving a report configuration does not freeze the underlying records, so counts can change as your team works.
Next: [Filter a report](/docs/help/reporting/filters) or [add charts and summaries](/docs/help/reporting/charts).
## Understand the report workspace
| Control | Purpose |
| - | - |
| Fields | Choose the information available from the selected source and enabled relationships. |
| Columns | Review and arrange the fields shown in the output. |
| Filters | Restrict which records qualify. |
| Join | Include information from related records, such as the case attached to a task. |
| Run Report | Refresh the displayed results using the current configuration. |
| Full Preview | Inspect the result table in its preview view. |
| Visualization / Chart | Configure and view charts based on the report. |
| Summary Rows | Add a footer calculation such as Count. |
| Save | Preserve the report configuration for later use. |
The saved report editor uses `/dashboard/reports/builder?reportId=…`. Open it by selecting the report in Reporting; the identifier belongs to that saved report.
## Worked example: a task report with case information
1. Create a report from **My Tasks** and inspect its starting rules. This template uses **Owner ID Equals Current User**; that field does not automatically mean Assigned To.
2. Add a title filter if you need a narrower set—for example, **Title Contains \[DEMO]** for an internal demonstration.
3. In **Join**, select **Cases** to make related case fields available.
4. Add **Case Type** from the expanded field choices.
5. Run the report and inspect a task with a case and, if present, one without a case.
6. Add a Count summary, save, and reopen the report to verify the configuration.
Choose joins deliberately: they can change which rows appear and how many rows represent one task. See [Include related records](/docs/help/reporting/joins).
Continue with [exports and scheduled delivery](/docs/help/reporting/delivery), [home dashboards](/docs/help/reporting/dashboards), or the [firm portfolio](/docs/help/reporting/portfolio).
## Shared reports and organization labels
Opening a shared child-owned report from HQ keeps its original owner and field definitions; it does not automatically create a copy. Your permissions and selected organization scope determine which records can appear. Lead and matter status cells show the record's own label and organization, for example **Appeal Filed (Washington)**. This presentation carries through report previews, dashboard tables, and saved-report exports.
The saved filters still apply. A Converted-only report does not include Matched–Direct unless an authorized editor changes the filter. See [status filters and organization scope](/docs/help/reporting/filters#status-labels-across-offices).
## Run, save, and reopen
1. Select **Run Report** to refresh the result table.
2. Inspect representative rows and the total row count. Check that the fields answer the question you started with.
3. Select **Save** and wait for confirmation.
4. Reopen the report and verify the selected columns and filters.
**Full Preview** displays the report results; **Chart** displays configured charts. Saving a report configuration does not freeze the underlying records, so counts can change as your team works.
Next: [Filter a report](/docs/help/reporting/filters) or [add charts and summaries](/docs/help/reporting/charts).
## Understand the report workspace
| Control | Purpose |
| - | - |
| Fields | Choose the information available from the selected source and enabled relationships. |
| Columns | Review and arrange the fields shown in the output. |
| Filters | Restrict which records qualify. |
| Join | Include information from related records, such as the case attached to a task. |
| Run Report | Refresh the displayed results using the current configuration. |
| Full Preview | Inspect the result table in its preview view. |
| Visualization / Chart | Configure and view charts based on the report. |
| Summary Rows | Add a footer calculation such as Count. |
| Save | Preserve the report configuration for later use. |
The saved report editor uses `/dashboard/reports/builder?reportId=…`. Open it by selecting the report in Reporting; the identifier belongs to that saved report.
## Worked example: a task report with case information
1. Create a report from **My Tasks** and inspect its starting rules. This template uses **Owner ID Equals Current User**; that field does not automatically mean Assigned To.
2. Add a title filter if you need a narrower set—for example, **Title Contains \[DEMO]** for an internal demonstration.
3. In **Join**, select **Cases** to make related case fields available.
4. Add **Case Type** from the expanded field choices.
5. Run the report and inspect a task with a case and, if present, one without a case.
6. Add a Count summary, save, and reopen the report to verify the configuration.
Choose joins deliberately: they can change which rows appear and how many rows represent one task. See [Include related records](/docs/help/reporting/joins).
Continue with [exports and scheduled delivery](/docs/help/reporting/delivery), [home dashboards](/docs/help/reporting/dashboards), or the [firm portfolio](/docs/help/reporting/portfolio).
## Shared reports and organization labels
Opening a shared child-owned report from HQ keeps its original owner and field definitions; it does not automatically create a copy. Your permissions and selected organization scope determine which records can appear. Lead and matter status cells show the record's own label and organization, for example **Appeal Filed (Washington)**. This presentation carries through report previews, dashboard tables, and saved-report exports.
The saved filters still apply. A Converted-only report does not include Matched–Direct unless an authorized editor changes the filter. See [status filters and organization scope](/docs/help/reporting/filters#status-labels-across-offices).