> ## Documentation Index
> Fetch the complete documentation index at: https://www.presolve.com/docs/llms.txt
> Use this file to discover all available pages before exploring further.
# Add charts and summary rows
> Summarize the same records you have checked in the report table.
Start with a saved report whose rows and filters you understand. [Run and inspect the report](/docs/help/reporting/build-report) before using a visualization to present its results.
## Add a status chart
1. Open **Visualization** and select **Add chart**.
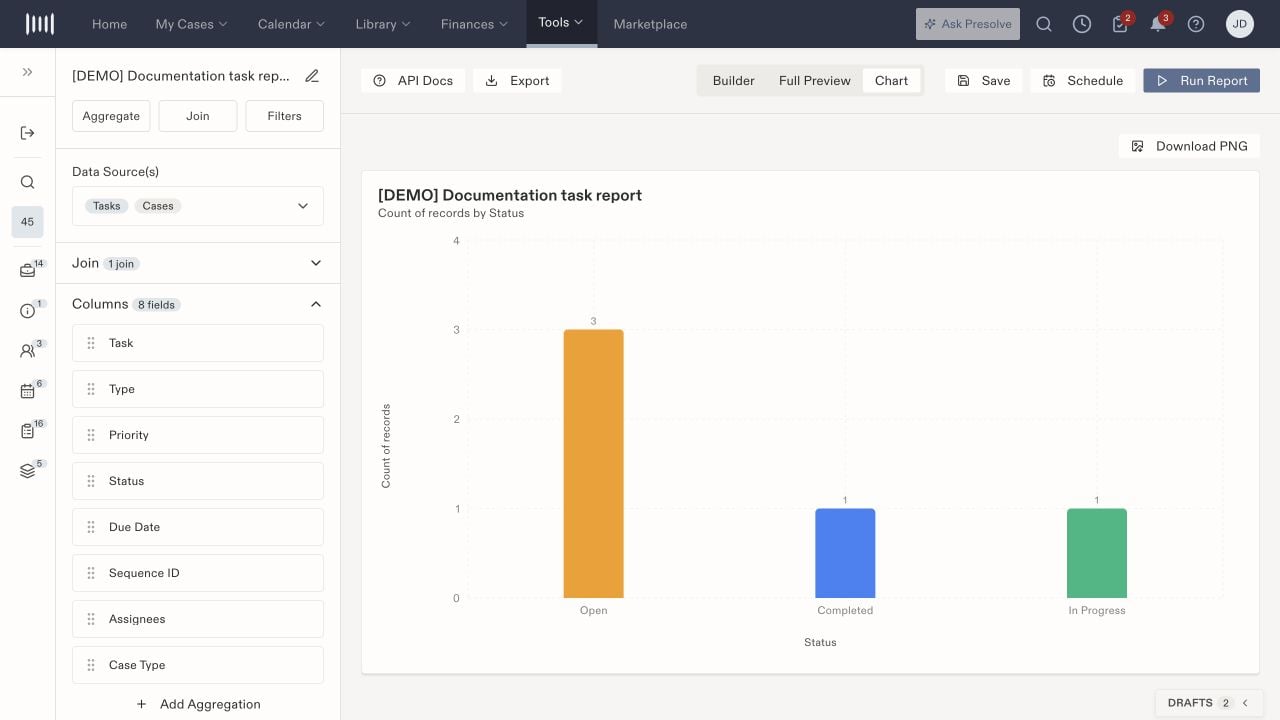
2. For a count of work by status, choose **Records**, **Count**, and group by **Status**.
3. Review the chart type and any split field.
4. Enable **Show values** if readers need the numbers displayed.
5. Compare the chart with the table, then save the report.
Bar, Line, Pie, and Donut choices are available, with additional chart types under **More chart types**. Number format and decimal settings affect presentation; they do not establish the meaning of a metric.
## Add a summary row
Open **Summary Rows**, choose the summary you need, and run the report. A **Count** summary displays a footer with the count. Other choices include Total, Average, Min, and Max. Choose a summary appropriate to the field rather than summing identifiers or unrelated values.
 **Add Aggregation** is a separate control for aggregated output columns. It asks for a field, function, and output alias. Do not confuse a footer summary with changing the report's output structure.
For export or scheduled delivery, inspect the destination and resulting file independently; a chart on screen does not establish that a downloaded image or emailed report was delivered. Related: [Report filters](/docs/help/reporting/filters).
**Add Aggregation** is a separate control for aggregated output columns. It asks for a field, function, and output alias. Do not confuse a footer summary with changing the report's output structure.
For export or scheduled delivery, inspect the destination and resulting file independently; a chart on screen does not establish that a downloaded image or emailed report was delivered. Related: [Report filters](/docs/help/reporting/filters).