> ## Documentation Index
> Fetch the complete documentation index at: https://www.presolve.com/docs/llms.txt
> Use this file to discover all available pages before exploring further.
# Build a home dashboard
> Turn saved reports into charts, tables, and summary widgets.
From [Home](https://attorney.dearlegal.com/dashboard), select **Manage dashboards**. The **Dashboard Builder** arranges saved reports into a view you can return to throughout the day. Prepare the report's columns, filters, and charts first using the [report builder](/docs/help/reporting/build-report).
## Add a report widget
1. Open the dashboard you want to edit, or open a [new dashboard](https://attorney.dearlegal.com/dashboard/dashboards/builder).
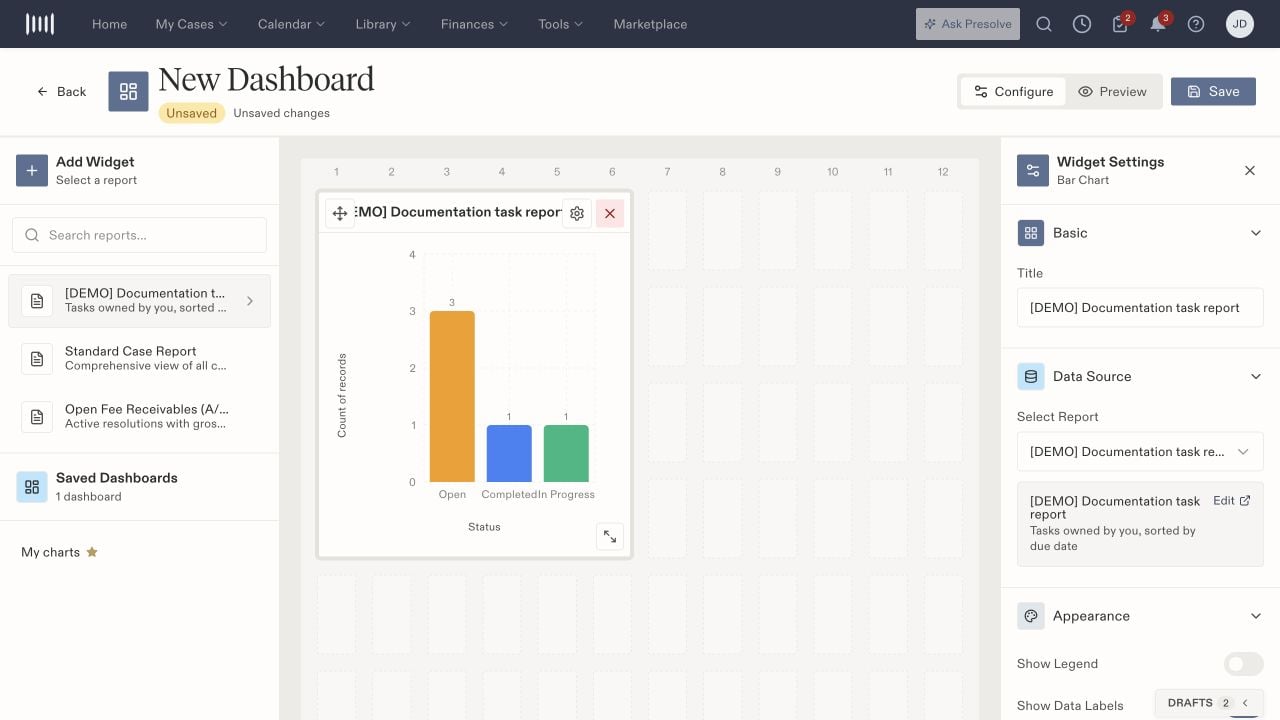
2. Under **Add Widget**, search for and select a saved report.
3. Choose one of its saved charts, **Stat Card**, or **Table**. A saved chart uses that chart's saved data and appearance.
4. Select the widget to open **Widget Settings**.
5. Review its title and data source, then arrange it on the layout grid using its drag handle and resize control.
 ## Configure the display
**Basic** contains the title. **Data Source** identifies the report and provides a link to edit it. Check the source before interpreting a widget: a report filtered to one owner or case type will retain that focus.
Chart **Appearance** options include legend and data labels, horizontal or stacked bars where applicable, prefixes/suffixes, and decimal places. **Office Display** text styling includes size, weight, and color. Available settings depend on the widget type.
Stat Cards have two display modes:
* **Row Count** counts all rows matching the saved report, across every page. Use it for a Cases report filtered to **Surgery Completed? Equals Yes**. Grouped reports count groups, so leave the report ungrouped when counting cases.
* **First Cell Value** shows the first column of the first result row. Use it with a report whose first column is a Count, Sum, Average, or other summary value.
New Stat Cards choose Row Count for detail reports and First Cell Value for reports that begin with an aggregate and contain only summary values. You can change the mode under **Appearance → Display Mode**. Saved cards retain their selected mode.
A count with no matching rows displays **0**. An empty first cell displays **—**. Refresh the dashboard after changing matter values to update its metrics.
Use **Remove widget** to remove a widget from the layout. This is separate from deleting the underlying saved report.
## Preview and save
Select **Preview** to inspect the dashboard without the editing panels. Return to **Configure** for further changes. Check that titles and labels remain readable at the chosen widget size.
Select **Save**. For a new dashboard, enter a **Dashboard Name**, optionally add a description, and decide whether to **Set as default home page**. Leave that switch off when you are preparing an alternate view. Confirm the save and reopen the dashboard to verify the layout.
Turn on **Enable office display** to use your saved dashboard on a monitor or TV. Custom reports, charts, Stat Cards, and Tables are supported. Keep the layout within 12 widgets and 12 grid rows, and make sure the display account has access to every report.
## Manage saved dashboards
The **Saved Dashboards** menu offers actions such as Edit, Duplicate, changing the default, and Delete. Use Duplicate when making an alternate layout. Removing the default selection and deleting a dashboard are different actions; review the intended dashboard name before deleting.
On Home, use the Classic/Custom view selector and **Refresh custom dashboard** as needed. Report data can change as staff update records; a saved dashboard is a saved configuration, not a frozen report snapshot.
For the office-display setup, access requirements, and table display limits, see [Set up an office wallboard](/docs/help/reporting/wallboards).
## Follow recent case activity
**Recent Activity** appears below your Home dashboard in both Classic and Custom views. It shows up to 10 recent note additions, logged calls, and added files from cases you can access. Select an entry to open the relevant case record or document folder.
Choose **My cases** or **All accessible cases**, and filter by activity type. Collapse the section using its heading; your preference is saved for the current account and organization in this browser.
Select **View all** to open [Activity](https://attorney.dearlegal.com/dashboard/activity), where you can search by case or person, filter by date, and load more entries. Date filters use UTC. Select **New updates available** or the refresh button to load recent changes while leaving your dashboard reports in place.
Activity respects case and document access. Historical coverage depends on when events were first recorded; earlier call logs remain available in the case's [Records](/docs/help/records/review-activity).
## Configure the display
**Basic** contains the title. **Data Source** identifies the report and provides a link to edit it. Check the source before interpreting a widget: a report filtered to one owner or case type will retain that focus.
Chart **Appearance** options include legend and data labels, horizontal or stacked bars where applicable, prefixes/suffixes, and decimal places. **Office Display** text styling includes size, weight, and color. Available settings depend on the widget type.
Stat Cards have two display modes:
* **Row Count** counts all rows matching the saved report, across every page. Use it for a Cases report filtered to **Surgery Completed? Equals Yes**. Grouped reports count groups, so leave the report ungrouped when counting cases.
* **First Cell Value** shows the first column of the first result row. Use it with a report whose first column is a Count, Sum, Average, or other summary value.
New Stat Cards choose Row Count for detail reports and First Cell Value for reports that begin with an aggregate and contain only summary values. You can change the mode under **Appearance → Display Mode**. Saved cards retain their selected mode.
A count with no matching rows displays **0**. An empty first cell displays **—**. Refresh the dashboard after changing matter values to update its metrics.
Use **Remove widget** to remove a widget from the layout. This is separate from deleting the underlying saved report.
## Preview and save
Select **Preview** to inspect the dashboard without the editing panels. Return to **Configure** for further changes. Check that titles and labels remain readable at the chosen widget size.
Select **Save**. For a new dashboard, enter a **Dashboard Name**, optionally add a description, and decide whether to **Set as default home page**. Leave that switch off when you are preparing an alternate view. Confirm the save and reopen the dashboard to verify the layout.
Turn on **Enable office display** to use your saved dashboard on a monitor or TV. Custom reports, charts, Stat Cards, and Tables are supported. Keep the layout within 12 widgets and 12 grid rows, and make sure the display account has access to every report.
## Manage saved dashboards
The **Saved Dashboards** menu offers actions such as Edit, Duplicate, changing the default, and Delete. Use Duplicate when making an alternate layout. Removing the default selection and deleting a dashboard are different actions; review the intended dashboard name before deleting.
On Home, use the Classic/Custom view selector and **Refresh custom dashboard** as needed. Report data can change as staff update records; a saved dashboard is a saved configuration, not a frozen report snapshot.
For the office-display setup, access requirements, and table display limits, see [Set up an office wallboard](/docs/help/reporting/wallboards).
## Follow recent case activity
**Recent Activity** appears below your Home dashboard in both Classic and Custom views. It shows up to 10 recent note additions, logged calls, and added files from cases you can access. Select an entry to open the relevant case record or document folder.
Choose **My cases** or **All accessible cases**, and filter by activity type. Collapse the section using its heading; your preference is saved for the current account and organization in this browser.
Select **View all** to open [Activity](https://attorney.dearlegal.com/dashboard/activity), where you can search by case or person, filter by date, and load more entries. Date filters use UTC. Select **New updates available** or the refresh button to load recent changes while leaving your dashboard reports in place.
Activity respects case and document access. Historical coverage depends on when events were first recorded; earlier call logs remain available in the case's [Records](/docs/help/records/review-activity).