

Start from a template
- Select New Report.
- Search the available templates or choose to duplicate an existing report.
- Give the report a recognizable name and create it.
- Inspect its data source, columns, and existing filters before changing anything. A template may already restrict the results.
Choose what appears
Use the Fields panel to add columns. Review Columns to see which fields are selected and reorder them for the reader. When you need information from a related record, inspect Join and then the expanded field choices. For example, joining Cases to a task report makes case fields available. Some tasks have no case, so check what your chosen join does to those rows. Fields added through Matter Layout appear under Custom matter fields. You can include them in columns and filters, group by supported fields, and summarize numbers or currency. Multi-select fields support Has Any Of, Has None Of, and empty/nonempty filters. The same inherited field appears once across its applicable case types. Fields removed from a layout remain available with an Archived label, so saved reports can continue to show historical values. Custom matter fields are scoped to their owning organization. For a Yes / No field such as Surgery Completed?, you can build two saved reports:- Completed surgery counter: use Cases, filter Surgery Completed? Equals Yes, and add a Count aggregation of that field as the only output column. Save the report, then add it to a dashboard as a Stat Card with First Cell Value.
- Yes / No bar chart: use Cases, add Surgery Completed?, and configure a bar chart with that field as the label and Records as the metric. Leave off the Yes-only filter so both answers appear. Save the chart and add it to the dashboard.
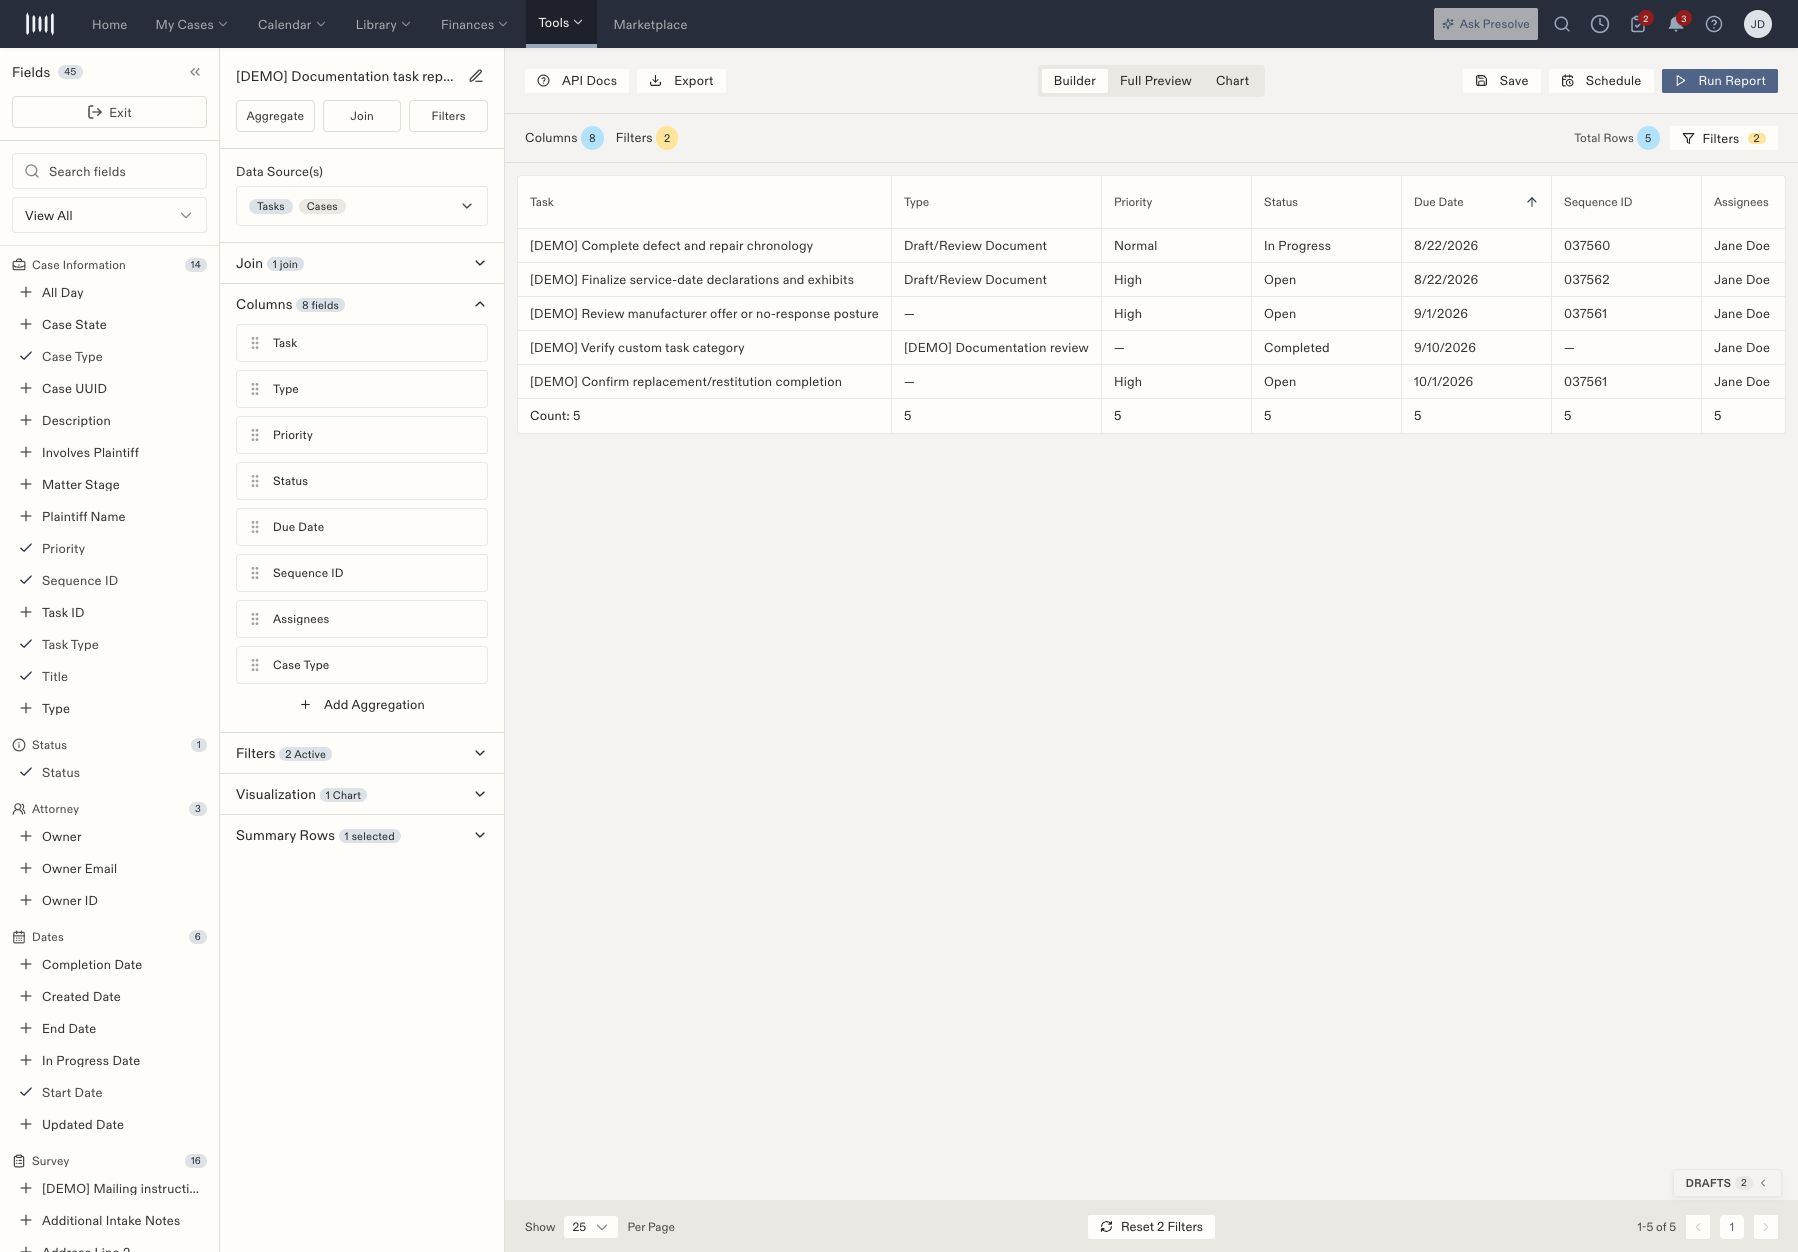
A saved task report with selected fields, five fictional rows, and a Count summary.
Run, save, and reopen
- Select Run Report to refresh the result table.
- Inspect representative rows and the total row count. Check that the fields answer the question you started with.
- Select Save and wait for confirmation.
- Reopen the report and verify the selected columns and filters.
Understand the report workspace
The saved report editor uses
/dashboard/reports/builder?reportId=…. Open it by selecting the report in Reporting; the identifier belongs to that saved report.
Worked example: a task report with case information
- Create a report from My Tasks and inspect its starting rules. This template uses Owner ID Equals Current User; that field does not automatically mean Assigned To.
- Add a title filter if you need a narrower set—for example, Title Contains [DEMO] for an internal demonstration.
- In Join, select Cases to make related case fields available.
- Add Case Type from the expanded field choices.
- Run the report and inspect a task with a case and, if present, one without a case.
- Add a Count summary, save, and reopen the report to verify the configuration.