

What your team needs
- An account with access to analytics and reports. Creating the Operations template also requires permission to create reports.
- Office displays enabled for your organization. Ask your administrator if Use Operations KPI template is missing from a new dashboard.
- A supported dashboard layout: at most 12 widgets and a layout that fits within 12 grid rows.
- A signed-in browser on the display device, with access to the dashboard and its reports. The display URL is not a public sharing link.
Start from Home
- Open Home.
- Select Create Dashboard if you do not have a custom dashboard. If Home shows Manage dashboards, use it to edit your saved dashboard. To start separately, open a new dashboard.
- Under Add Widget, select a saved report, then choose one of its saved charts, Stat Card, or Table. Repeat for each widget you want.
- Alternatively, select Use Operations KPI template on an empty dashboard to create the ready-made Operations Dashboard and its reports.
- Review the data and filters before changing the layout.
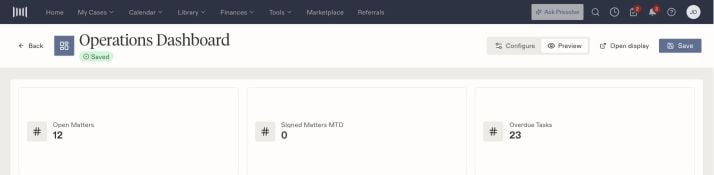
The Operations Dashboard preview includes summary cards and an Open display link. This is the builder preview, before opening the separate display page.
Arrange and style your widgets
Use Configure to work on the layout. Select a widget to open Widget Settings, then use its drag handle and resize control to arrange it. Office Display settings let you choose text size, weight, and color. Check the result in Preview, especially if people will read the screen from across a room. Remove widgets you do not need with Remove widget. This removes the widget from this dashboard; it does not delete the source report.For a custom lead dashboard such as “Today,” “Last 7 Days,” and “Last 30
Days,” build and save the corresponding filtered reports first. Add them as
Stat Cards using the row-count setting, check each date filter, then enable
office display when saving the dashboard. The same saved filters and report
access apply on Home and on the display.
Save and open the display
- Select Save in the builder.
- Review the dashboard name and description.
- Turn on Enable office display. If the control is disabled, read the requirement shown beside it.
- Choose whether to Set as default home page. This controls what you see on Home and is separate from enabling the office display.
- Confirm with Save for a new dashboard or Update for an existing one.
- Use Open display to open the dedicated page. On your display device, sign in with an authorized account and open that dashboard’s display URL. Use your browser’s full-screen mode if desired.
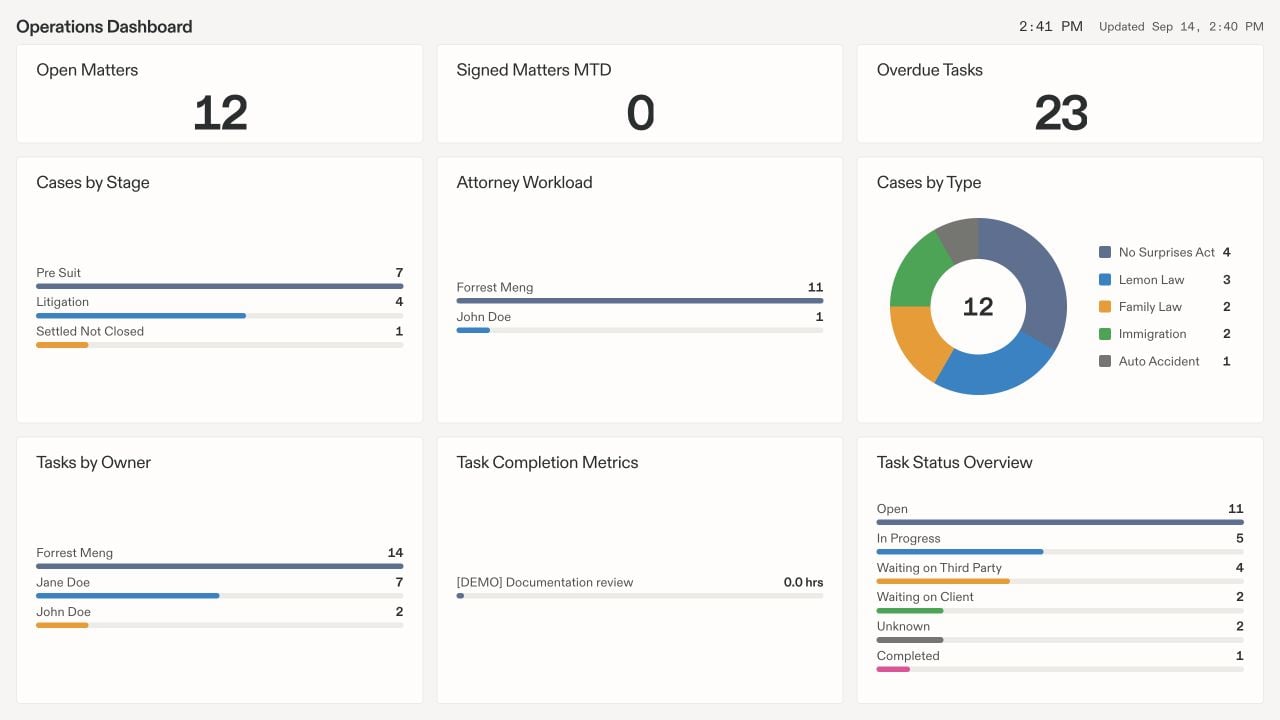
The separate office display shows the Operations Dashboard's KPI cards and charts without the case-navigation or editing panels.