

Add a report widget
- Open the dashboard you want to edit, or open a new dashboard.
- Under Add Widget, search for and select a saved report.
- Choose one of its saved charts, Stat Card, or Table. A saved chart uses that chart’s saved data and appearance.
- Select the widget to open Widget Settings.
- Review its title and data source, then arrange it on the layout grid using its drag handle and resize control.
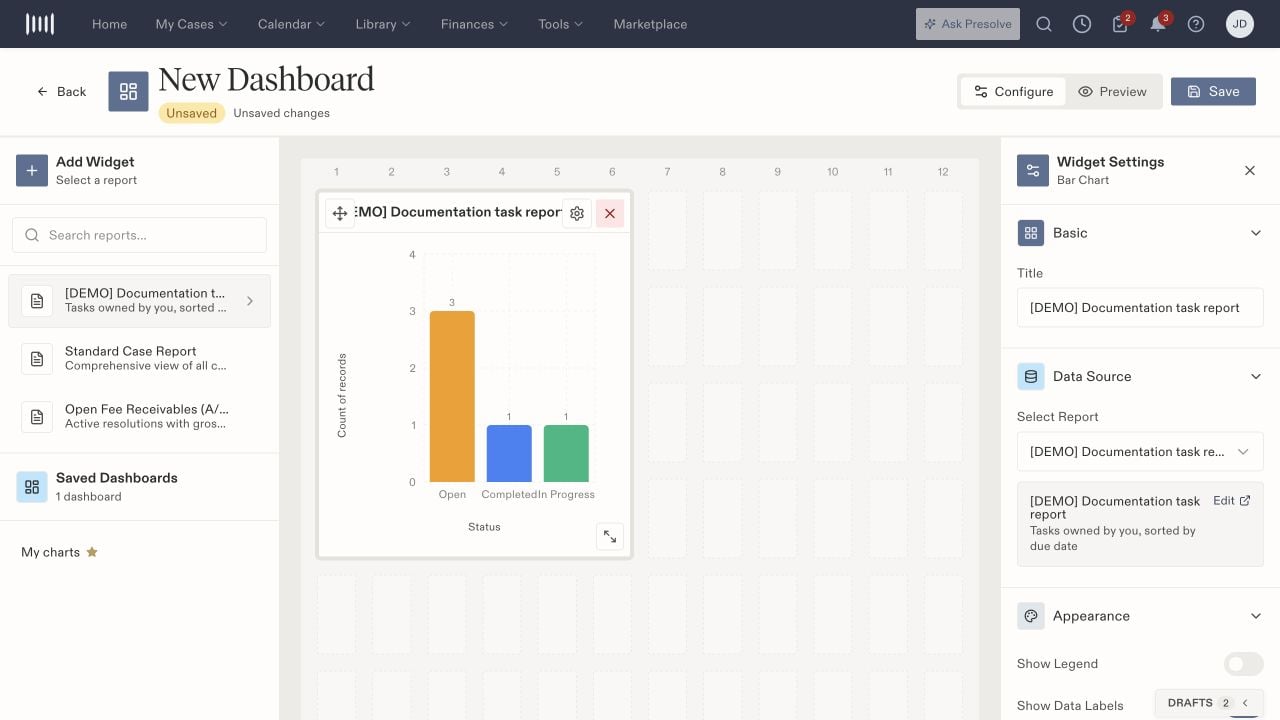
A new dashboard with a chart from the fictional task report.
Configure the display
Basic contains the title. Data Source identifies the report and provides a link to edit it. Check the source before interpreting a widget: a report filtered to one owner or case type will retain that focus. Chart Appearance options include legend and data labels, horizontal or stacked bars where applicable, prefixes/suffixes, and decimal places. Office Display text styling includes size, weight, and color. Available settings depend on the widget type. Stat Cards have two display modes:- Row Count counts all rows matching the saved report, across every page. Use it for a Cases report filtered to Surgery Completed? Equals Yes. Grouped reports count groups, so leave the report ungrouped when counting cases.
- First Cell Value shows the first column of the first result row. Use it with a report whose first column is a Count, Sum, Average, or other summary value.